How can I use PostHog for analytics dashboards in Coursebox?
Coursebox integrates with PostHog to help you visualise key user engagement metrics and make data-driven decisions.
Watch the tutorial videos found in our YouTube Video Library.
What You Can Track in PostHog
PostHog dashboards can display metrics such as:
DAUs (Daily Active Users) – See how many unique users are active each day.
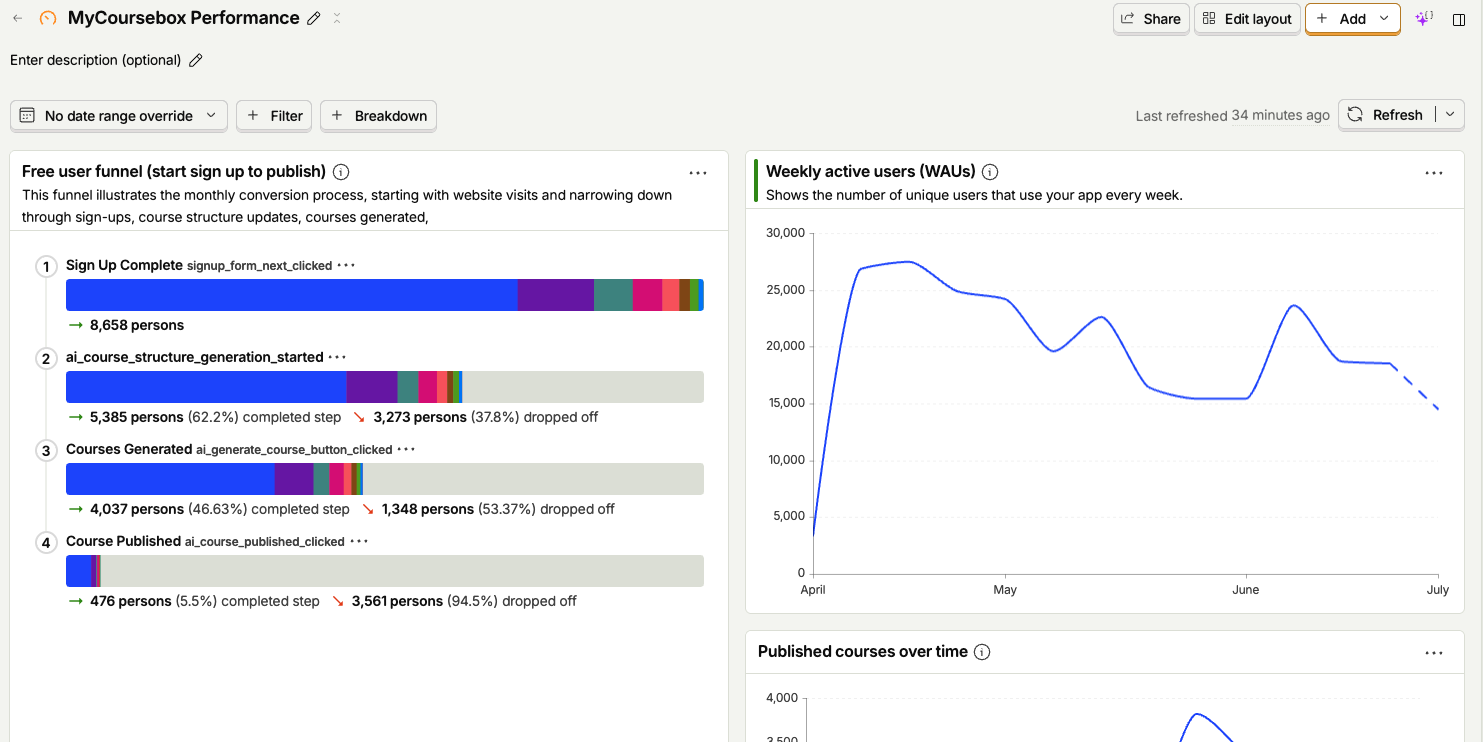
WAUs (Weekly Active Users) – Monitor trends in weekly engagement.
User Retention – Track how well you keep users coming back over time.
Growth Accounting – Understand user acquisition, churn, and reactivation.
Referral Traffic – Measure traffic from external sources.
Funnel Progression – Visualize how users move through key steps in your course or sales process.
The Coursebox Team can help you configure tracking events and metrics tailored to your organization's needs.
Access Your Analytics Dashboards in PostHog
Log in to your Coursebox Admin Panel.
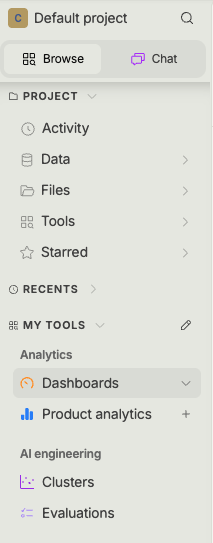
In the left-hand navigation menu, click Analytics.
Select Dashboards from the dropdown menu.
Choose the relevant dashboard for your review (e.g., Engagement Overview, Retention Trends).
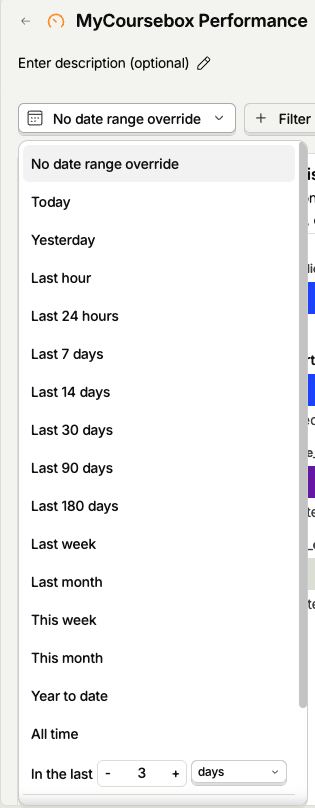
Apply filters such as date range, user segment, or course to refine your view.
Tips for Getting the Most Out of Your Dashboard:
Compare DAUs vs WAUs to detect shifts in short- vs long-term engagement.
Check retention rates monthly to identify any drops and investigate possible causes.
Monitor funnel conversion steps to see where users are dropping off.
Review referral sources to focus on high-performing marketing channels.