Report Management
Note for my.coursebox.ai users: To access the Reporting tab, you must be on a Creator or Pro plan. If you are on a free plan, the Reports section will not be visible. To upgrade, visit https://www.coursebox.ai/pricing
For Business & Enterprise Accounts only. To upgrade your account go to: https://www.coursebox.ai/pricing
Coursebox Branded Training Platform (Premium) includes a robust Reporting and Analytics dashboard designed to help Super Administrators and Facilitators monitor learner activity, track progress, and evaluate course effectiveness.
The dashboard provides valuable insights into how learners interact with your courses, including completion rates, time spent, assessment results, and more. These analytics help support informed decisions about course improvements, learner support, and training outcomes.
View Reports from the Dashboard
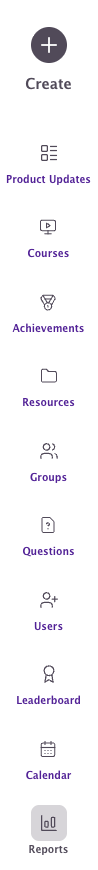
Click on the Reports menu on the left-hand side navigation bar to access the report section.
View Reports from a Course
From your Course click on the Graph Icon on the top menu.
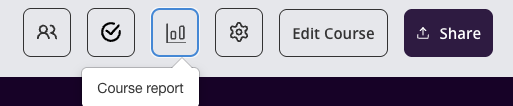
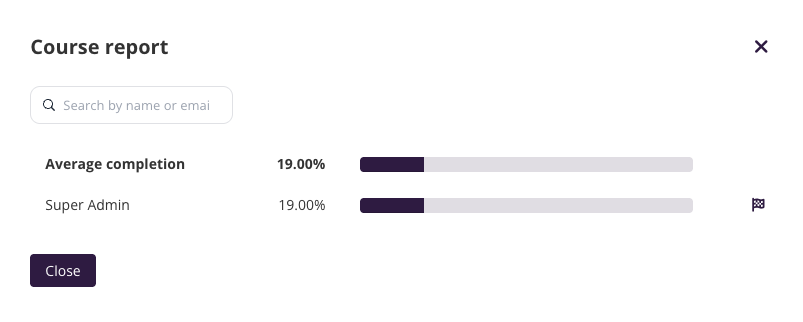
The following window will open:
Filtering reports
You can filter the report based on:
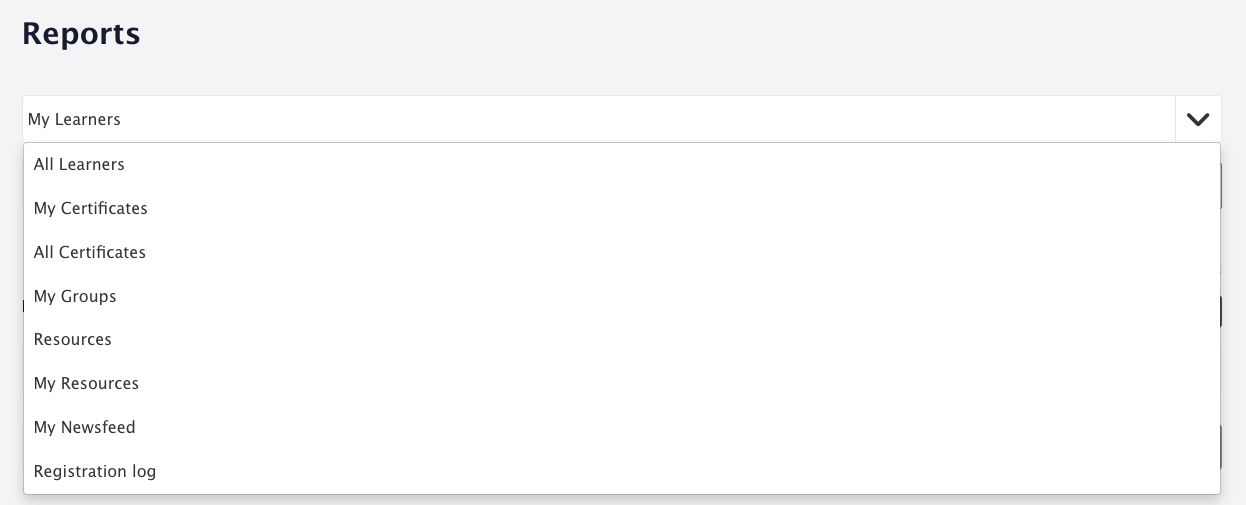
Types of Report: Click on the dropdown menu and select the type of report you want to view.
Date Range: Select your date range by changing Start Date and End Date Input.
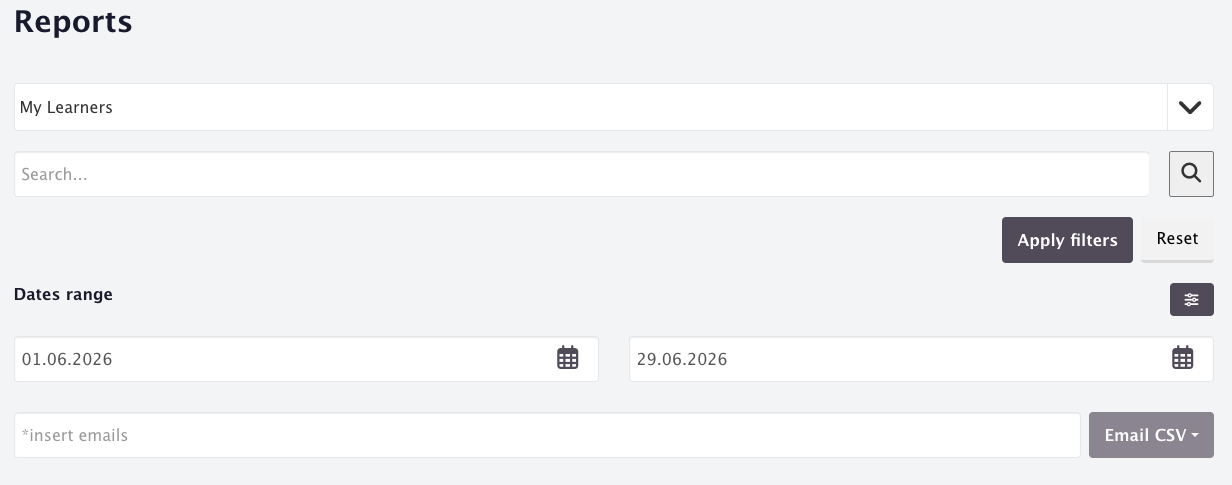
User Type: Click on the filter icon button to select users based on their status. Coursebox allows you to generate reports for active users, archived users and unconfirmed users.
Once you have set your filters, click on the Apply Filters button to generate the report. You can always reset to the default filter setting by clicking on the Reset button.
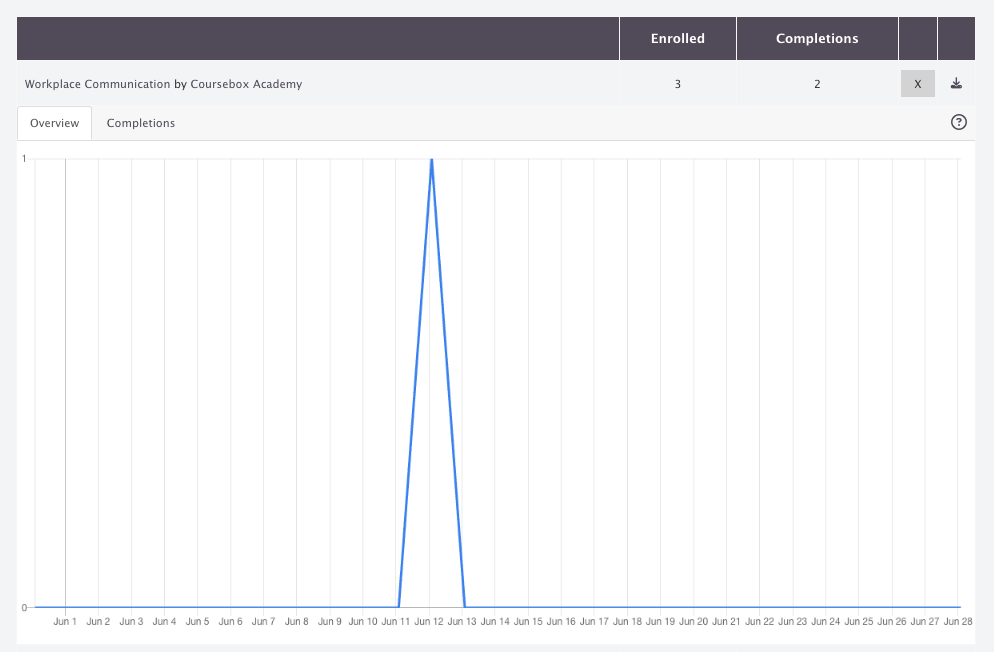
View Learner Reports
These reports provide insight into learner progress and engagement, either for your own courses (My Learners) or across the entire platform (All Learners). You can view interaction trends, completion status, and download detailed .CSV reports for analysis.
Note: Course reports can now be downloaded as a CSV even while a course is still in Draft status, so you can review learner interaction data before publishing. Deleted learners are now hidden from course reports by default, and the User Type status filter now lets you choose to include or exclude them alongside active, archived, and unconfirmed users.
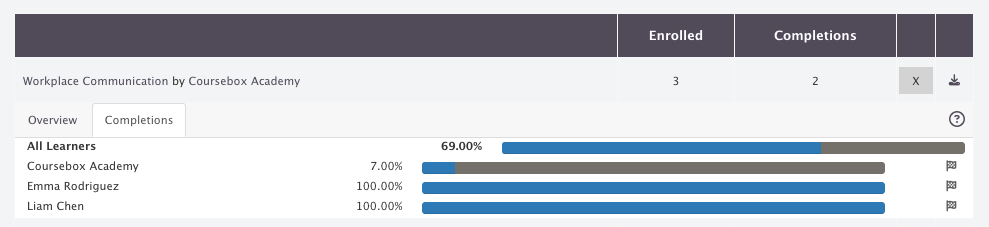
You can click on the graph icon to view day-wise course interaction reports and course completion status of individual learners.
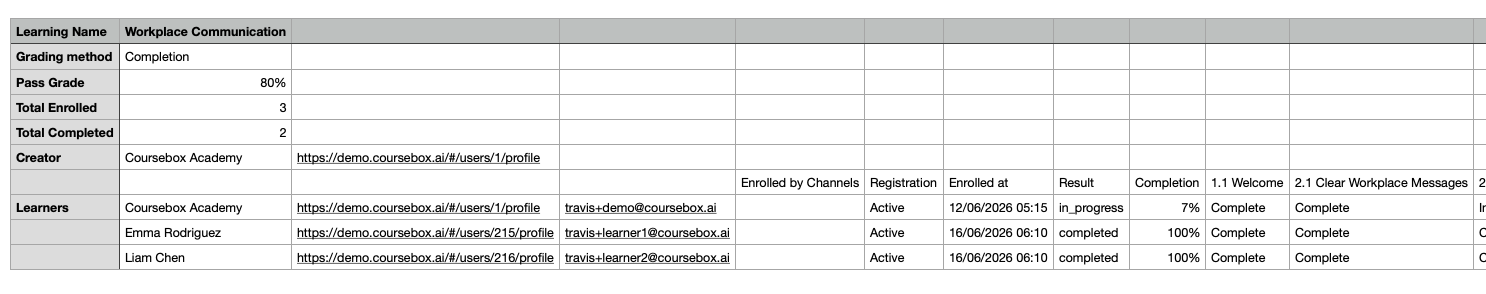
You can click on the download icon to download the report in .CSV file format. You can open the file using Excel or Google Sheets.
Group Administrator Visibility
If you are an administrator of a group, and that group is enrolled into a course, your access to learner reports will be limited to the learners in your group only.
For example:
A course may have 1,000 total students enrolled.
Your group may have 10 students enrolled in the same course.
As the group administrator, when you view reports for that course, you will only see the 10 students in your group, not the entire course list.
This ensures that group administrators can focus on monitoring the learners they are directly responsible for, without visibility into other groups' learners.
View Certificate Reports
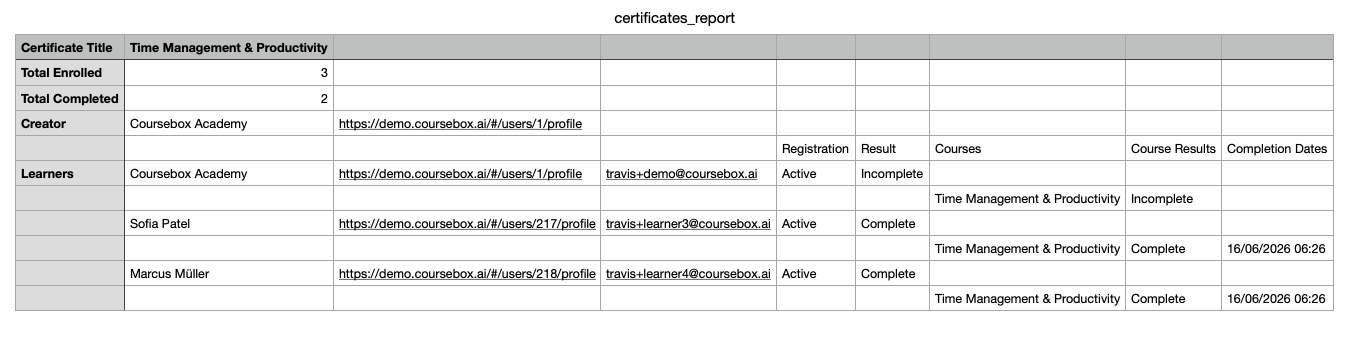
Track certificate achievements within your courses. My Certificates shows certificates you've earned, while All Certificates provides a platform-wide view of issued certificates—useful for compliance and outcome reporting.
Note: Certificate reports now show one row per learner. Previously a learner with multiple certificates could appear across several rows; all of a learner's certificate activity is now consolidated into a single row, making the report easier to scan and export.
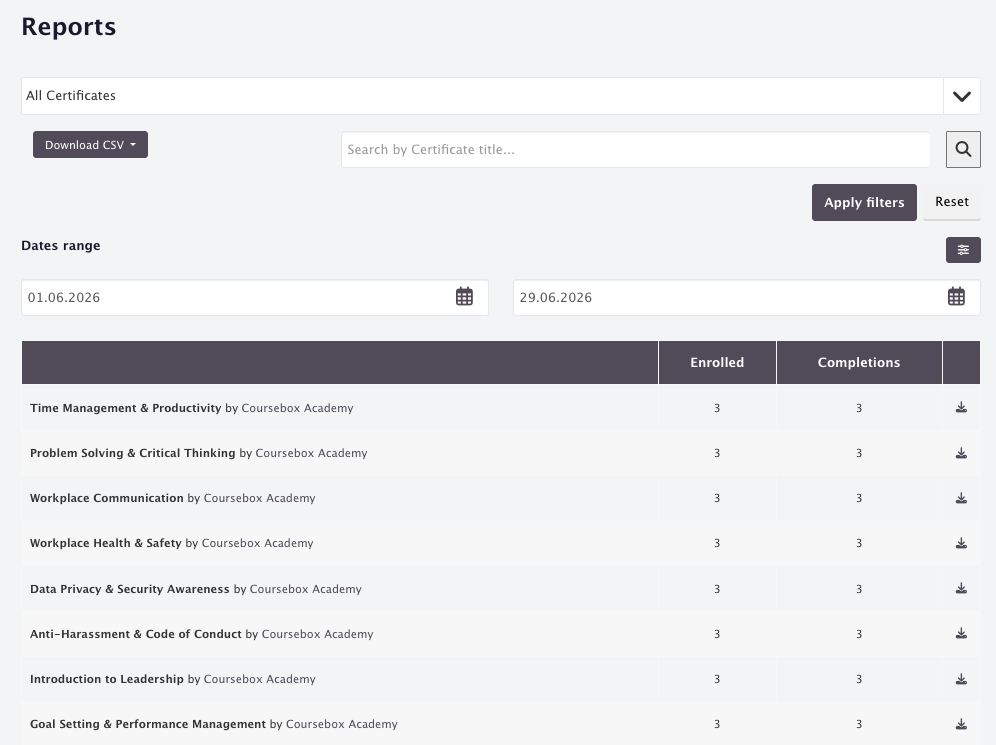
You can click on the download icon to download the report in .CSV file format. You can open the file using Excel or Google Sheets.
View Group Reports
Understand how learners engage within their assigned Groups. This report details Group-level activity, including posts, comments, and likes. It's ideal for measuring social learning impact and monitoring participation by cohort or team.
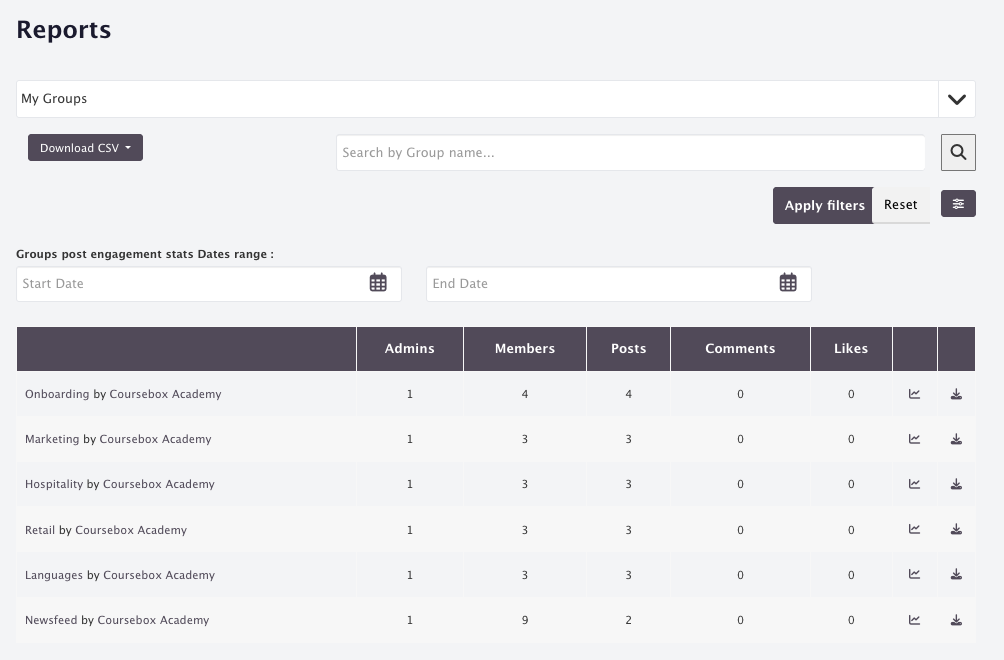
The definitions of the metrics are as follows:
Admin: No. of admins of the Group.
Members: No. of members of the Group.
Posts: No. of posts made in the Group within the time frame selected.
Comments: No. of comments made in the Group within the time frame selected.
Likes: No. of likes made in the Group within the time frame selected.
You can click on the graph icon to view day-wise social engagement reports of the Group.
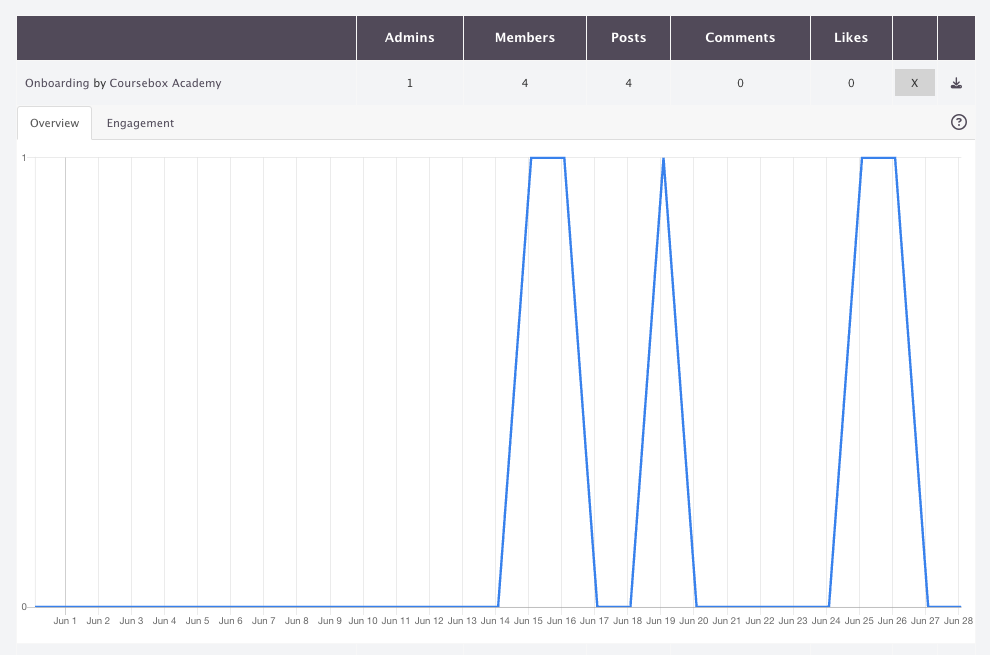
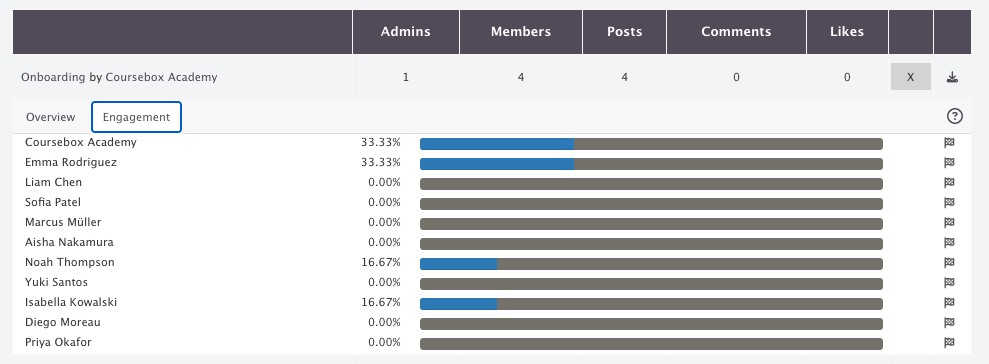
The Overview tab shows how many users interacted with the Group.
Engagement is comparative and the total user engagement is scored out of 100% based on count of posts, comments and likes.
Similar to other reports, you can click on the download icon to download the report in .CSV file format. You can open the file using Excel or Google Sheets.
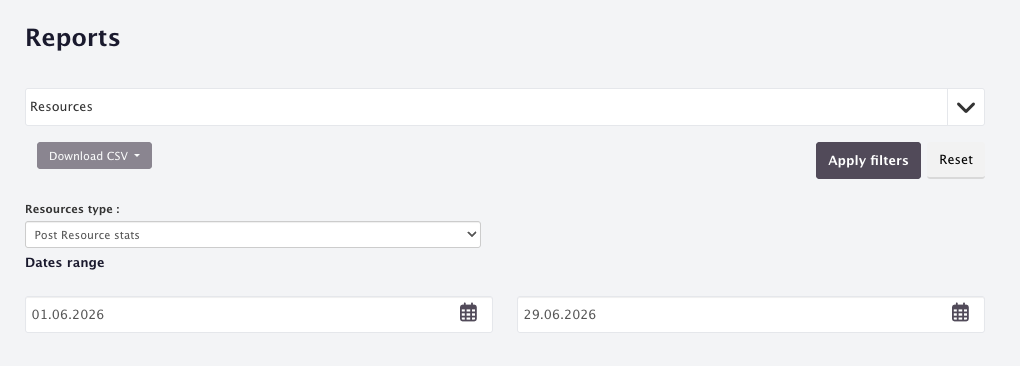
View Resources Reports
Monitor access and usage of resources you've uploaded or shared. This helps ensure materials are being used effectively and allows you to assess whether additional support or updates are needed.
View Newsfeed Reports
Analyse learner engagement across social features like posts, likes, and comments. The Newsfeed report offers detailed metrics and graphs to show how actively users are interacting with your community content.
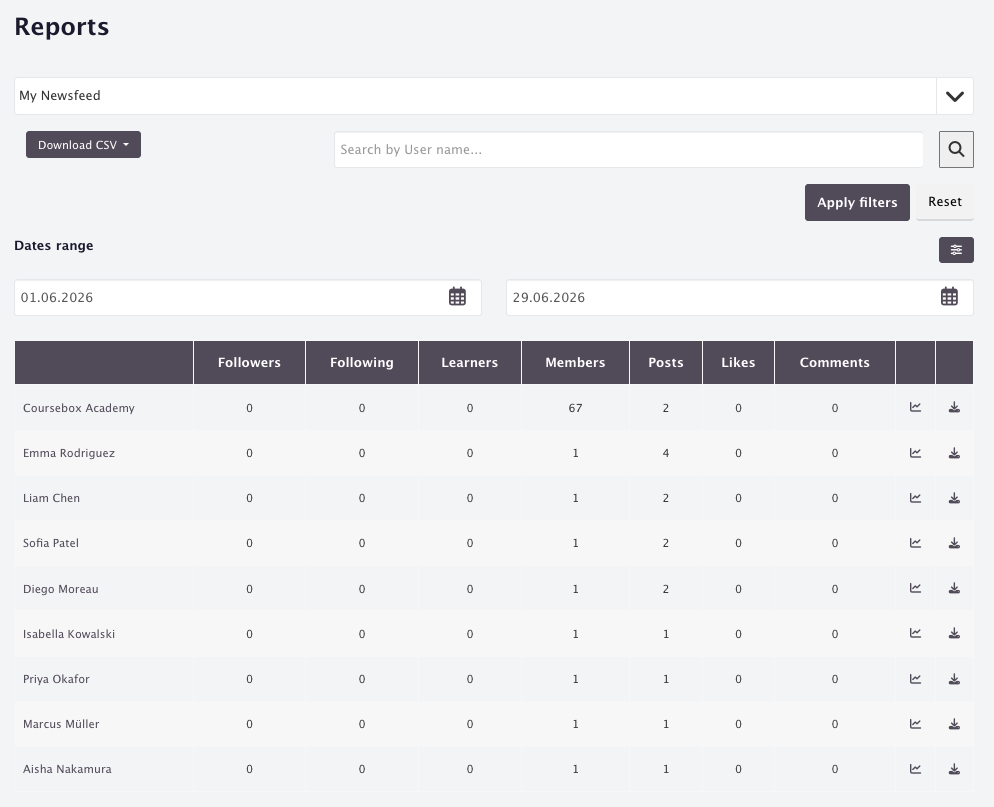
You can click on the graph icon to view day-wise social engagement reports of the learners.
You can click on the download icon to download the report in .CSV file format. You can open the file using Excel or Google Sheets.
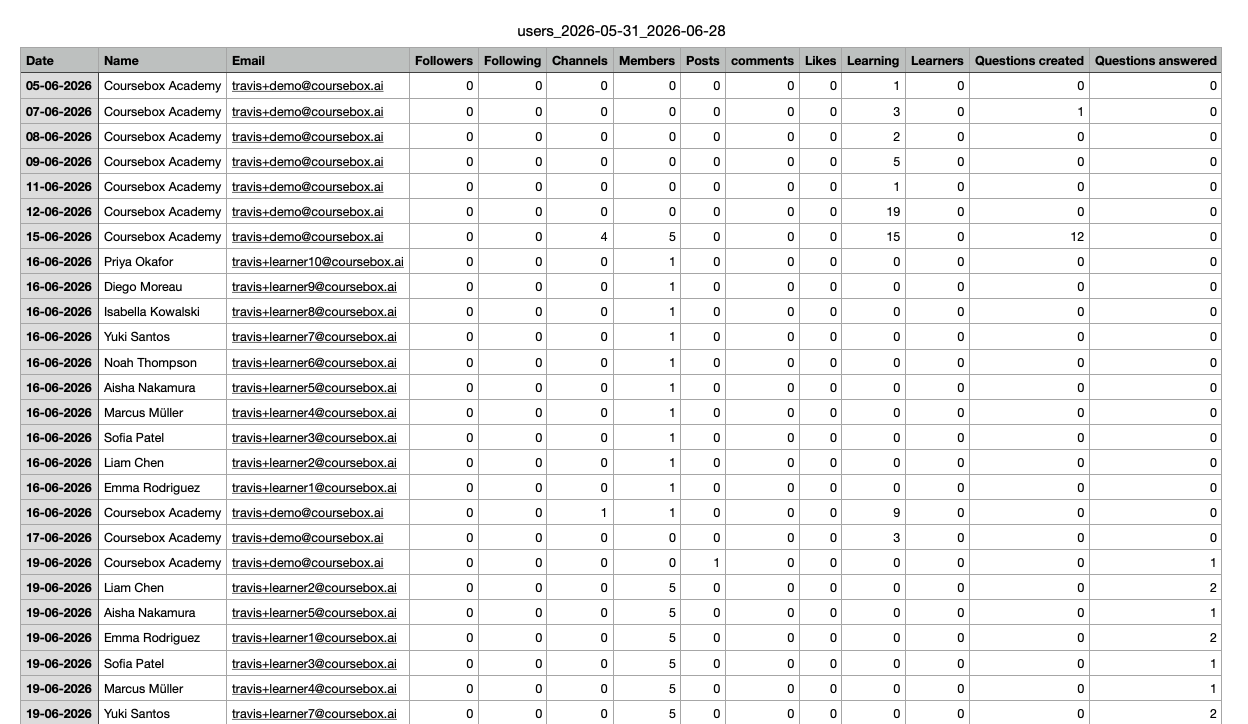
The definitions of the metrics are as follows:
Followers: No. of users following the user. In Coursebox Branded Training Platform (Premium), any user can follow/unfollow another user, which basically means they will see their posts, similar to other social networking sites like Twitter and Instagram. By default, all users follow the super admin. The super admin can control the setting to enable/disable auto-follow features.
Followings: No. of users the user is following.
Learners: No. of users who are learning from the user.
Members: No. of total members in the Groups owned by the user.
Posts: Total no. of posts made by the user within the time period selected.
Likes: Total no. of likes received by the user on his/her posts within the time period selected.
Comments: Total no. of comments received by the user on his/her posts within the time period selected.
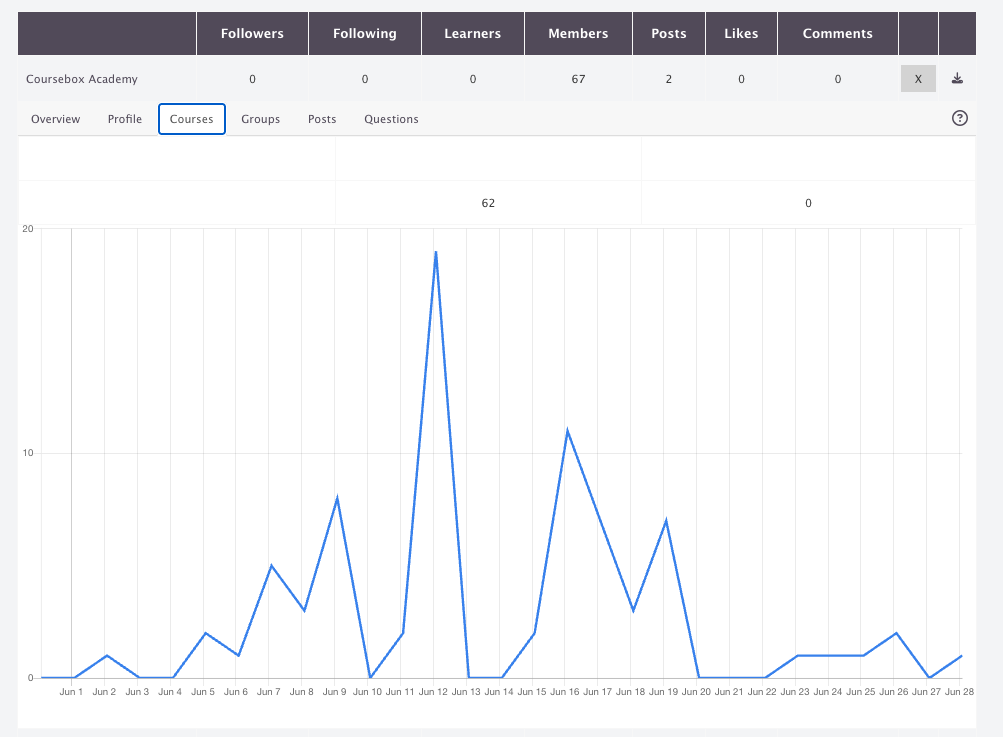
The definitions of the metrics on the graphs are as follows:
Overview: The Overview tab shows how many users interacted with one of my Groups, courses, posts, or profile in any way in the past 30 days.
Profile: The Profile tab shows how many users interacted with my profile in any way.
Learning: The Learning tab shows how many users interacted with my courses in any way.
Groups: The Groups tab shows how many users interacted with my Groups in any way.
Posts: The posts tab shows how many users interacted with my posts in any way.
Questions: The Questions tab shows how many users interacted with my questions in any way.
Download the Registration Log Report
The Registration Log provides a downloadable record of all confirmed and unconfirmed user registrations. Use this for onboarding tracking, user management, or audit purposes.
The registration reports are available only in .CSV file format. Click on the download icon to download the file.
Troubleshooting Reports
The reports section shows no data.
Ensure learners have been enrolled and have started interacting with the course. Reports only populate once learner activity has occurred. Also check that your date range filter covers the period you are investigating — click Reset to return to the default filter settings.
I can't download a CSV report.
Click the download icon on the right side of the report. If the download doesn't start, check that your browser is not blocking file downloads. The file will open in Excel or Google Sheets.
My report only shows some learners, not all.
If you are a Group Administrator, you will only see learners in your group by design. If you are a Super Admin and still see limited data, check your User Type filter — it may be set to Active only, excluding archived or unconfirmed users. Click Reset to return to default filter settings.